Free · No Signup · Cloudflare-Powered

Test Your Internet Speed
in Seconds — Free

Measure your real download speed, upload speed, ping and jitter. Accurate results using Cloudflare's global network — no apps, no registration.

MBPS
Download
Upload
Ping ms
Connecting…
Click above to measure your internet speed
🌐
Cloudflare Network
🔒
No Data Stored
Instant Results
📱
All Devices
Understand Your Results

What Is a Good Internet Speed?

Your speed requirements depend on how many people share your connection and what you use it for. Use this table to compare your results.

Activity Min Download Recommended Upload Needed Good Ping
📺 4K Streaming (Netflix/YouTube)25 Mbps50 MbpsAny
📺 HD Streaming (1080p)5 Mbps15 MbpsAny
🎮 Online Gaming (casual)3 Mbps25 Mbps1 Mbps<50ms
🎮 Competitive Gaming (FPS)10 Mbps50 Mbps5 Mbps<20ms
💻 Zoom / Video Calls (HD)4 Mbps10 Mbps4 Mbps<100ms
🏠 Work From Home10 Mbps50 Mbps10 Mbps<100ms
📡 Live Streaming (Twitch)6–8 Mbps<50ms
👨‍👩‍👧‍👦 Family of 4 (simultaneous)50 Mbps100 Mbps20 MbpsAny
☁️ Cloud Backup / File Transfer25+ MbpsAny

Not sure what your results mean? Read our full guide: What Is a Good Internet Speed? →

Your Data

Your Test History

Your last 20 speed tests are saved locally in your browser — no account needed, no data sent to our servers.

Run a speed test above to see your history here.

Free Network Tools

All Internet Testing Tools

Three dedicated tools to diagnose every aspect of your internet connection — all free, all accurate.

Internet Speed Test

Measures your real download and upload speeds using Cloudflare's global CDN infrastructure — not a dedicated test server. Results reflect your actual streaming and browsing experience.

  • Download speed in Mbps/Gbps
  • Upload speed measurement
  • Ping and jitter included
  • Animated real-time gauge
Run Speed Test
📡

Ping Test

Sends 10 timed packets to Cloudflare's 1.1.1.1 server to measure your true network latency. See minimum, maximum, average ping and packet loss percentage — critical for gaming and video calls.

  • 10-packet live test
  • Min, max, average, loss
  • Colour-coded live log
  • Gaming-focused benchmarks
Run Ping Test
〰️

Jitter Test

Jitter is the variation in your ping over time — the metric that explains choppy video calls even when average ping looks fine. 15 measurements give you an accurate stability rating.

  • 15-sample measurement
  • Animated bar chart
  • Stability rating
  • Video call compatibility check
Run Jitter Test
Why InternetSpeedTesters.online

A speed test that gives you honest results

Most popular speed test tools route your test through servers specifically optimized for testing — which produces inflated numbers that don't reflect your real streaming, gaming, or video call experience. InternetSpeedTesters.online uses Cloudflare's production network for an honest benchmark.

  • Real-world network — tested against Cloudflare's CDN, not a dedicated test server
  • All 4 metrics in one test — download, upload, ping, and jitter measured simultaneously
  • Zero signup, zero tracking — test instantly, every time, completely free
  • Works on every device — mobile, tablet, desktop, laptop — any browser
  • Test history saved locally — track your speeds over time without creating an account

How to Get Accurate Results

1
Use Ethernet cable, not Wi-Fi

Wi-Fi reduces measured speed by 20–60%. Connect directly to your router for your true ISP plan speed.

2
Close all other tabs and apps

Background apps consuming bandwidth (cloud sync, updates, streaming) will reduce your measured speed.

3
Test 3 times at different hours

Morning (7 AM), afternoon (2 PM), and evening peak (8 PM). Speeds often drop 30–50% during peak hours.

4
Compare to your advertised plan speed

You should get at least 80% of your advertised speed during off-peak hours. Lower consistently = contact your ISP.

Speed Test Explained

What Do Download Speed, Upload Speed, Ping and Jitter Mean?

Your speed test shows four numbers. Here is exactly what each one means and how it affects your internet experience.

⬇️

Download Speed

How fast data arrives at your device. Affects streaming, browsing, and file downloads. The number ISPs advertise most prominently.

Good: 50+ Mbps for most households
⬆️

Upload Speed

How fast data leaves your device. Critical for video calls, live streaming, and cloud backups. Often 5–10× slower than download on cable plans.

Good: 10+ Mbps for WFH/calls
⏱️

Ping / Latency

Round-trip time in milliseconds. The most important metric for gaming and video calls. Low ping = responsive, high ping = lag and delay.

Good: Under 50ms for gaming
〰️

Jitter

Variation in ping over time. High jitter causes choppy audio and video in calls even when average ping is acceptable. Often overlooked.

Good: Under 10ms for calls
Full Guide: How to Read Your Speed Test Results →
ISP Speed Guides

What Speed Results Are Normal for Your Provider?

ISP-specific guides for major providers in the US, UK, Canada, and Australia — know what to expect and how to document slow speeds.

🇺🇸
Xfinity (Comcast)
25–6,000 Mbps
Plans
78–92%
Real Speed %
15–35ms
Avg Ping
View Xfinity Speed Guide →
🇺🇸
AT&T Internet
100 Mbps–5 Gbps
Plans
82–97%
Real Speed %
10–25ms
Avg Ping
View AT&T Speed Guide →
🇺🇸
Spectrum
300 Mbps–1 Gbps
Plans
75–90%
Real Speed %
15–40ms
Avg Ping
View Spectrum Speed Guide →
🇬🇧
BT Broadband
36–900 Mbps
Plans
65–88%
Real Speed %
12–30ms
Avg Ping
View BT Speed Guide →
🇬🇧
Virgin Media
100 Mbps–2 Gbps
Plans
70–92%
Real Speed %
15–35ms
Avg Ping
View Virgin Speed Guide →
🇦🇺
Telstra (NBN)
25–1,000 Mbps
Plans
72–90%
Real Speed %
10–20ms
Avg Ping
View Telstra Speed Guide →
All ISP Speed Guides →
Internet Speed Guides

Learn About Your Broadband Connection

In-depth guides to help you understand, fix, and optimize your internet speed.

View All Articles →
FAQ

Frequently Asked Questions

Our speed test uses Cloudflare's global production network — the same infrastructure serving millions of websites. Results are typically within 5–10% of your actual browsing and streaming experience, making them more representative than tools using dedicated test servers that inflate results.
Internet speed varies throughout the day. Network congestion during peak hours (typically 7–10 PM) can reduce speeds by 20–50% compared to off-peak hours. Test at different times to understand your connection's full range. Morning tests typically reflect your best possible speed.
For most households: 100 Mbps download and 20 Mbps upload comfortably handles 4K streaming on 2 devices, gaming, video calls, and working from home simultaneously. Households with 5+ people or 10+ devices benefit from 200–500 Mbps plans.
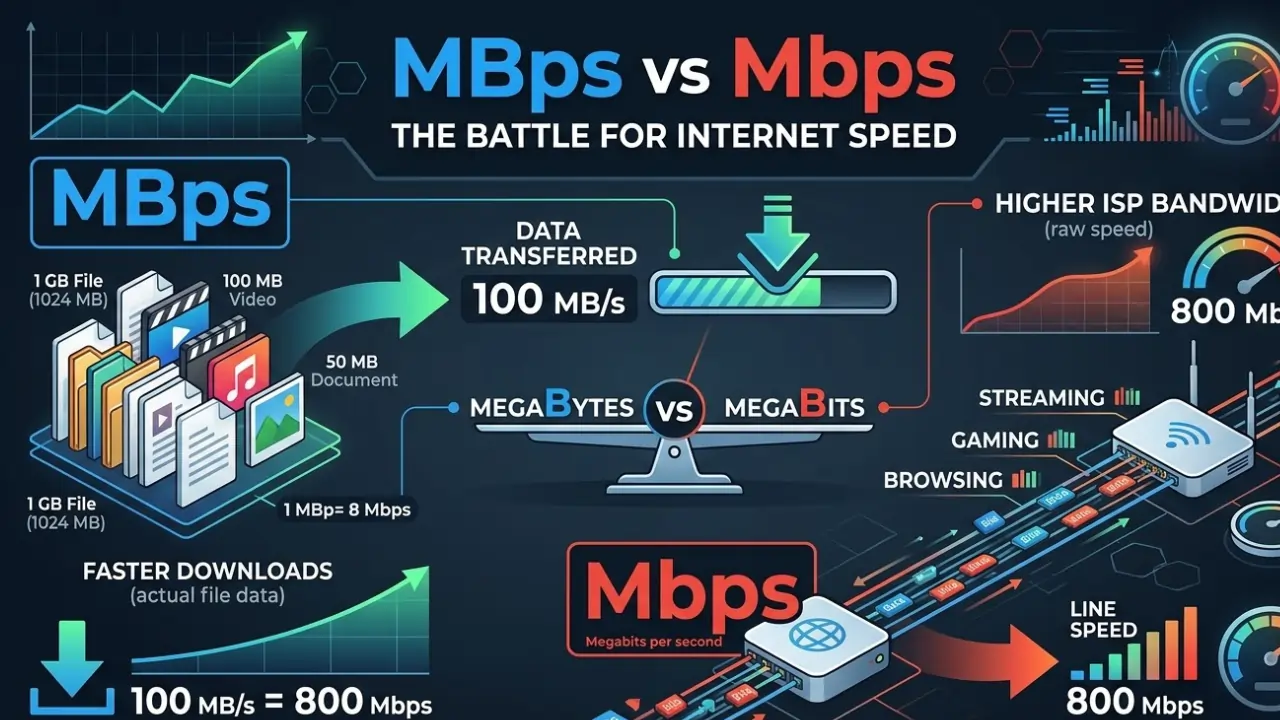
Mbps (lowercase b) = megabits per second — used by ISPs to advertise plan speeds. MBps (uppercase B) = megabytes per second — used by download managers for file transfer speeds. There are 8 bits in 1 byte, so 100 Mbps download speed = 12.5 MBps actual file download speed.
ISPs advertise maximum speeds that few customers consistently achieve. Common causes include: Wi-Fi signal losses (test via Ethernet for accurate results), peak-hour network congestion, older modem or router hardware, and distance from your ISP's network node. You should receive at least 80% of advertised speed via Ethernet during off-peak hours.
Jitter is the variation in your ping over time. A ping of 30ms with 5ms jitter is excellent. But if your ping jumps between 10ms and 90ms, your jitter is ~80ms — which causes choppy audio, frozen video, and lag in calls and gaming even though the average ping looks acceptable.